
Software case study · Energy & Solar
SunPlot 3D — Solar PV Design & Simulation Software
Browser-based 3D solar design with module-level shading, measured-climate yield forecasts and one-click client proposals.
In brief: A browser-based solar PV design tool for laying out modules, checking shading and yield, and producing client proposals without a site visit or desktop software.
- Status
- Delivered — custom version in use; open-source core live
- Climate history
- 10 years (NASA POWER)
- Shading performance
- ~1 s for 3,250 modules
- Proposal output
- 5-page PDF, in the browser
- Financial horizon
- 25 years
- Site types
- Homes, flat roofs, carports, shelters, airports, land
Overview
About the project
SunPlot 3D is a browser-based solar PV design tool. Installers lay out modules on a 3D model of the site, check shading and yield against measured climate data, and generate a client-ready proposal — without a site visit or desktop software.
A custom version was delivered for a US solar company to support design and sales. It handles houses, flat roofs, carports, bus shelters, airports and open land, from a 3.5 kWp home in Jaipur to a 1.8 MWp airport installation.
Presented as portfolio work from our founder-led engineering team. Client names, commercial terms and business performance figures are not published.
The challenge
- Installers need an accurate production estimate before visiting a site; estimates based on 'typical weather' erode customer trust.
- An incorrect figure in a proposal creates commercial problems later in the sale.
- Manual layouts miss setbacks and can cause rows to shade one another.
- Hand-built proposals were slow to produce and inconsistent from one customer to the next.
Features
What the platform does.
Interactive 3D studio
A live 3D model of the system with yearly energy from measured climate and a full loss breakdown.
Panel placement and adjustment
Add or remove a module, row, column or whole array, or paint across slots — with undo, redo, fill all, clear and keyboard shortcuts.
Code-aware auto layout
Applies ridge and edge setbacks and keep-outs around chimneys, vents and HVAC, and skips roof planes too small for four modules.
Winter-solstice row spacing
Row pitch is calculated from the winter-solstice noon sun so rows do not shade each other.
Module-level shading
Ray-cast shading from trees, roofs and other rows for every module, sampled every half hour on representative days, shown as a heat map.
Climate-based forecasting
Ten years of NASA POWER irradiation, temperature and rainfall data for the exact location, with P50 and P90 yield estimates.
Weather and snow modelling
Soiling, snow cover and heat losses modelled and presented as a loss waterfall; snow is visualised in 3D.
Site survey workflow
Address search, building outline selection on satellite imagery, obstacle marking and system sizing from the electricity bill, with subsidy calculation for Indian rooftops.
Automated proposal PDF
A one-click, five-page proposal generated in the browser: 3D view, plan, arrays, monthly energy, losses, climate and 25-year financials.
System architecture
How it's put together.
01Interface
React 19 single-page application with three.js and React Three Fiber for the 3D scene
02Computation
Shading ray-casting in a Web Worker so the 3D view stays responsive
03Climate data
NASA POWER — ten years of location-specific irradiation, temperature and precipitation
04Geospatial
OpenStreetMap and Photon for search; Overture Maps for building outlines
05Output
Client-side PDF proposal generation
06Hosting
Cloudflare Workers; built with Vite
Technical challenges
Problems worth solving properly.
- Accurate estimates without a site visit
- Ten years of NASA POWER data for the exact coordinates, P50 and P90 yields to communicate uncertainty, and explicit soiling, snow and heat loss modelling.
- Shading without freezing the browser
- Shading runs in a Web Worker, sampled half-hourly on representative days — roughly one second for 3,250 modules.
- Compliant layouts by default
- Setbacks, keep-outs, winter-solstice row pitch and minimum roof-plane size are encoded in the auto-layout, so every design starts compliant.
- Proposals customers can sign
- A consistent five-page PDF is generated in one click, directly from the design.
Technology
Stack
- React 19
- three.js
- React Three Fiber
- Web Workers
- Vite
- NASA POWER
- OpenStreetMap
- Photon
- Overture Maps
- Client-side PDF
- Cloudflare Workers
Outcomes
Where it stands.
- The custom version is in use for design and sales proposals.
- The open-source core is publicly available as a working demonstration.
- Every design produces a consistent, data-backed proposal.
- Quantified commercial results such as time saved or win rates are not published.
Related services
Industry solutions
More work
Other software case studies.
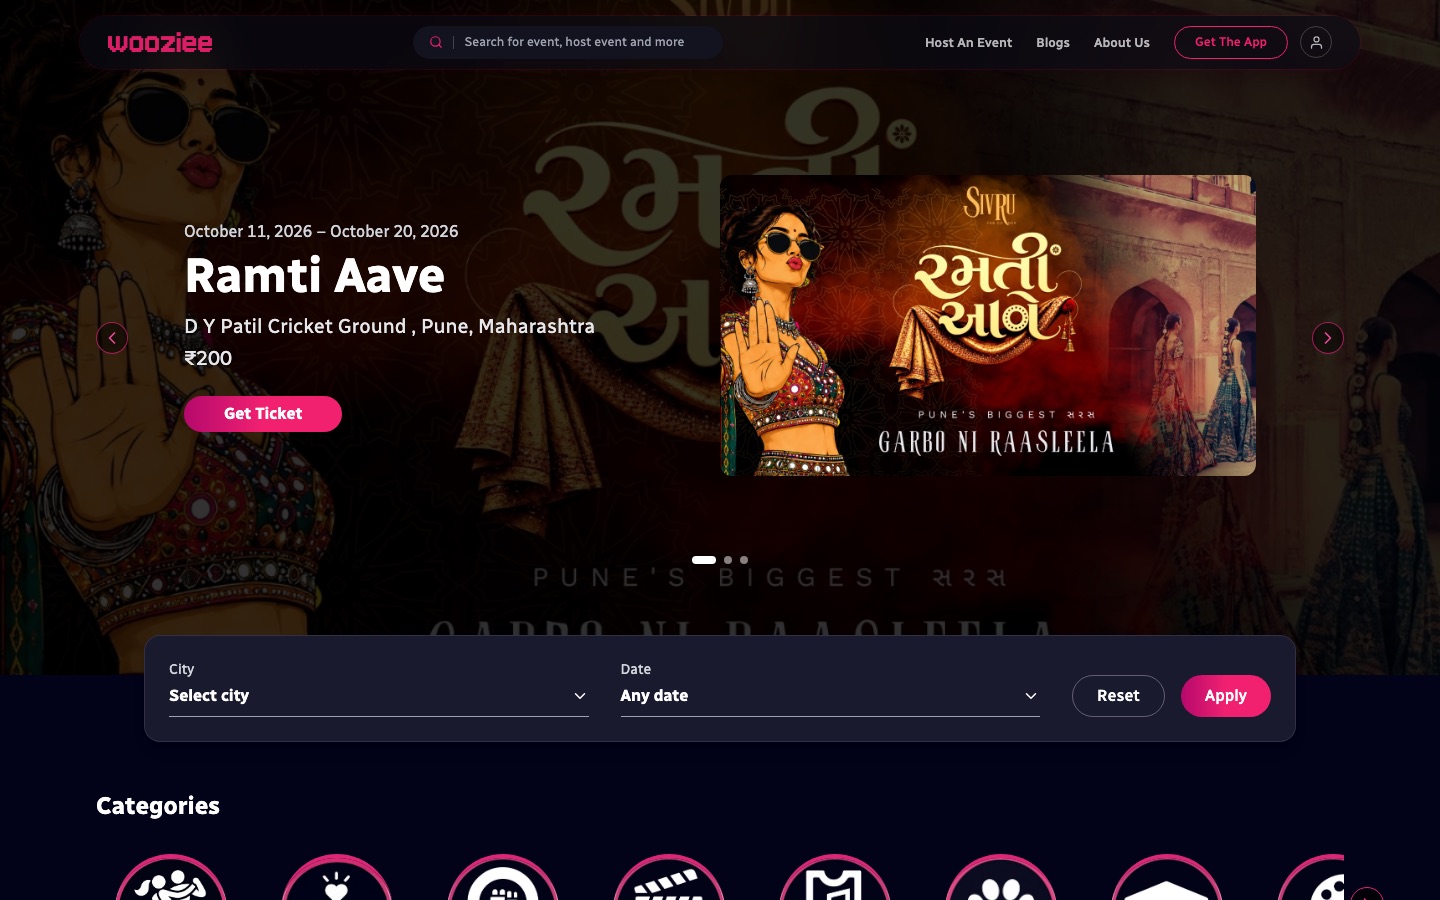
Events & Entertainment
Wooziee
One platform for discovery, checkout, QR entry, organiser analytics and payouts — across web, admin, Android and iOS.
- Web & Mobile
- SaaS & Platforms
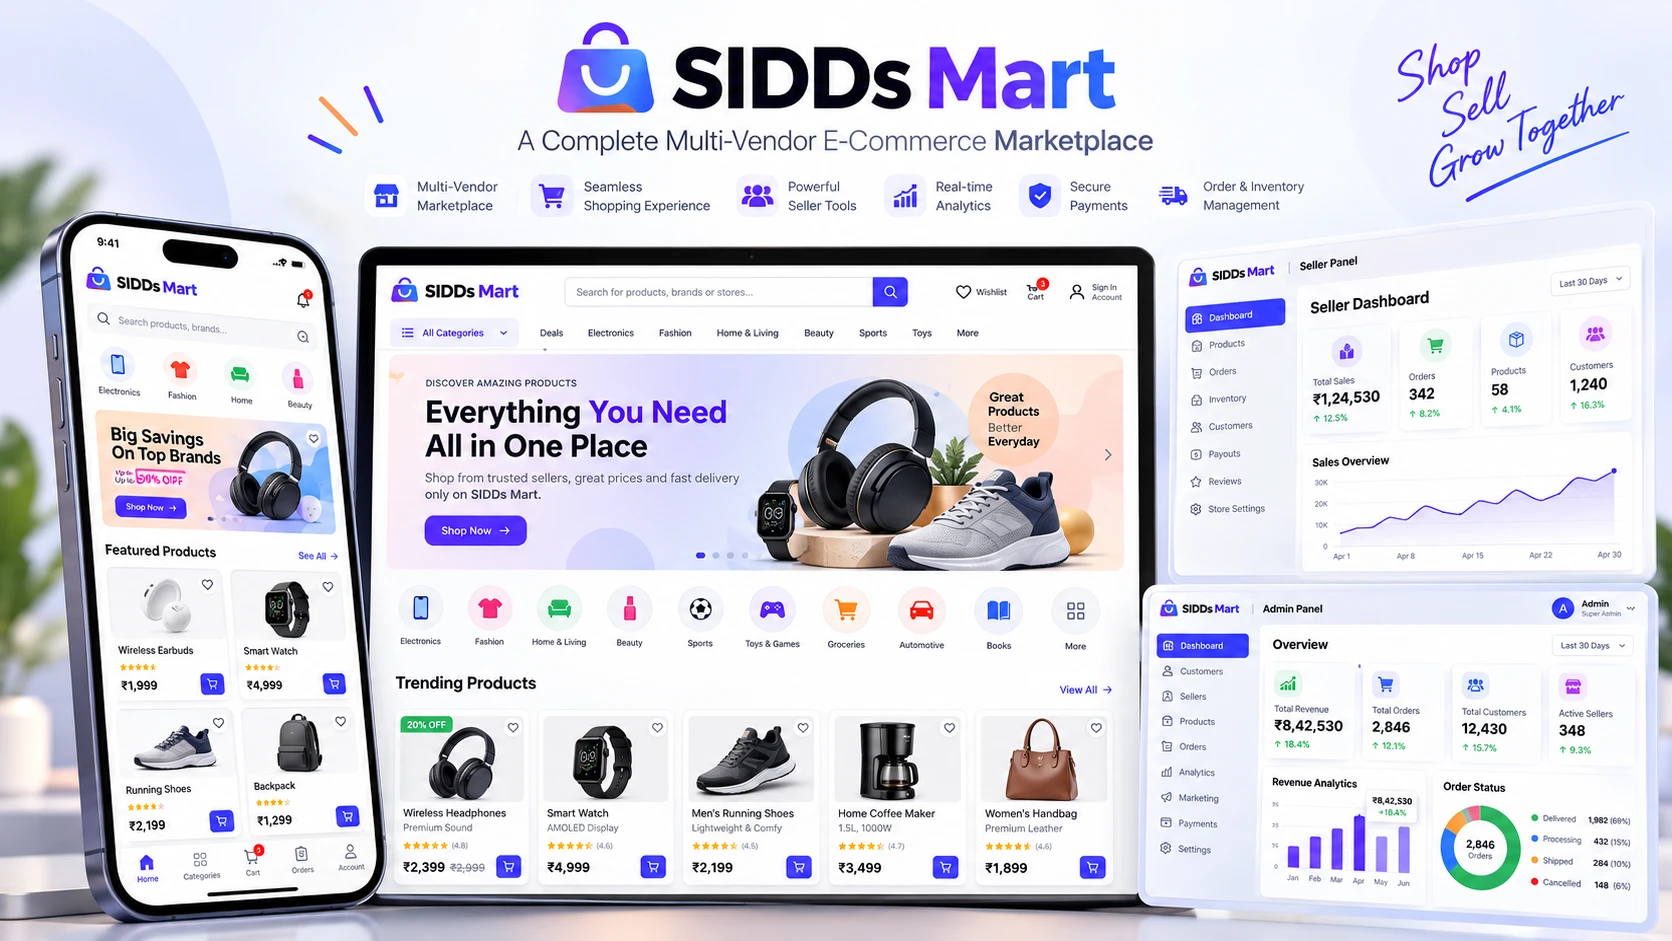
Retail & E-commerce
SIDDs Mart
An online marketplace that gives small vendors a storefront, with separate customer, seller and administration interfaces.
- E-commerce
- Web & Mobile

Events & Sport
Equestrian Competition Platform
Registrations, entries, secure payments, automated start orders and results — in one platform for organisers and riders.
- Business Applications
- SaaS & Platforms
Planning a platform of your own?
Tell us about the product, the users and the systems it needs to work with. We'll suggest an architecture and a sensible first release.