
Data Analytics & Business Intelligence
Know what's happening in the business — without building the report by hand.
Dashboards, automated reports and data pipelines that turn operational data into decisions.
At a glance
Most organisations have the data they need; it is just scattered across systems and locked in exports. We build pipelines, dashboards and automated reports that bring operational data together, define metrics consistently and deliver the right view to the right people.
Last updated
- Best for
- Weekly reports are compiled manually from several exports.
- Typical deliverables
- Operational and executive dashboards · Automated weekly and monthly reports · KPI definitions and metric layers
- Technologies
- SQL, MySQL, PostgreSQL, Python, pandas, Looker Studio
- Proven in
- ERP Order Analytics, Wooziee, Smart College Platform
The problem
What businesses tell us.
- Weekly reports are compiled manually from several exports.
- Different teams calculate the same metric in different ways.
- Dashboards exist but nobody trusts the numbers.
- Leaders only see problems after the month has closed.
- Product and operational data cannot be joined up.
Our approach
How we deliver it.
- 01
Define the questions
We start with the decisions you need to make, then define the metrics that inform them.
- 02
Build reliable pipelines
Scheduled extraction, cleaning and modelling create a trustworthy data layer.
- 03
Design focused dashboards
Fewer, clearer views with filters for time range, segment and location.
- 04
Automate delivery
Summaries are pushed to email, Slack, Discord or Teams on a schedule — with AI-assisted narrative where useful.
Features & capabilities
What's included.
- Operational and executive dashboards
- Automated weekly and monthly reports
- KPI definitions and metric layers
- Revenue, funnel and cohort analysis
- Data pipelines and scheduled ETL
- Embedded analytics in your product
- AI-assisted report summaries
- Forecasting and predictive models
Technologies & integrations
Tools we use.
- SQL
- MySQL
- PostgreSQL
- Python
- pandas
- Looker Studio
- Power BI
- Airtable
- Google Sheets
- n8n
- Chart.js
- Recharts
We choose tools to suit your existing systems, team skills and data requirements — not the other way round.
Relevant work
Examples from our portfolio.
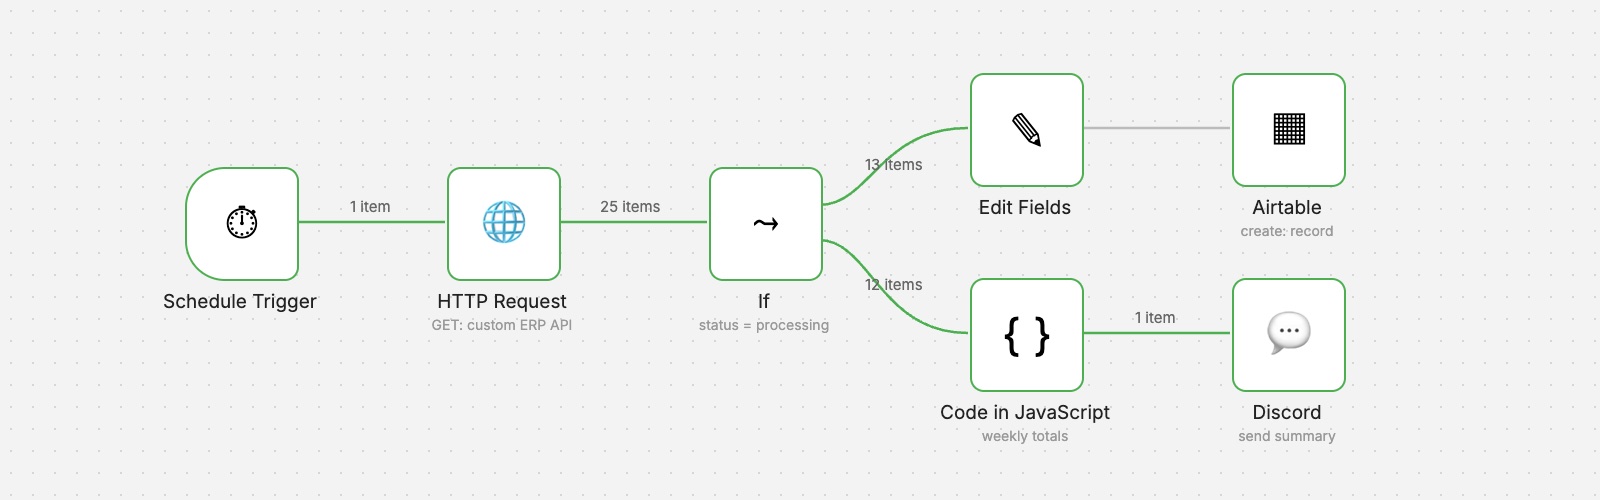 n8n workflow
Operations & Reporting
ERP Order Analytics
Scheduled order retrieval from a custom ERP, structured records in Airtable and a weekly performance summary posted to Discord.
- AI & Automation
- Business Applications
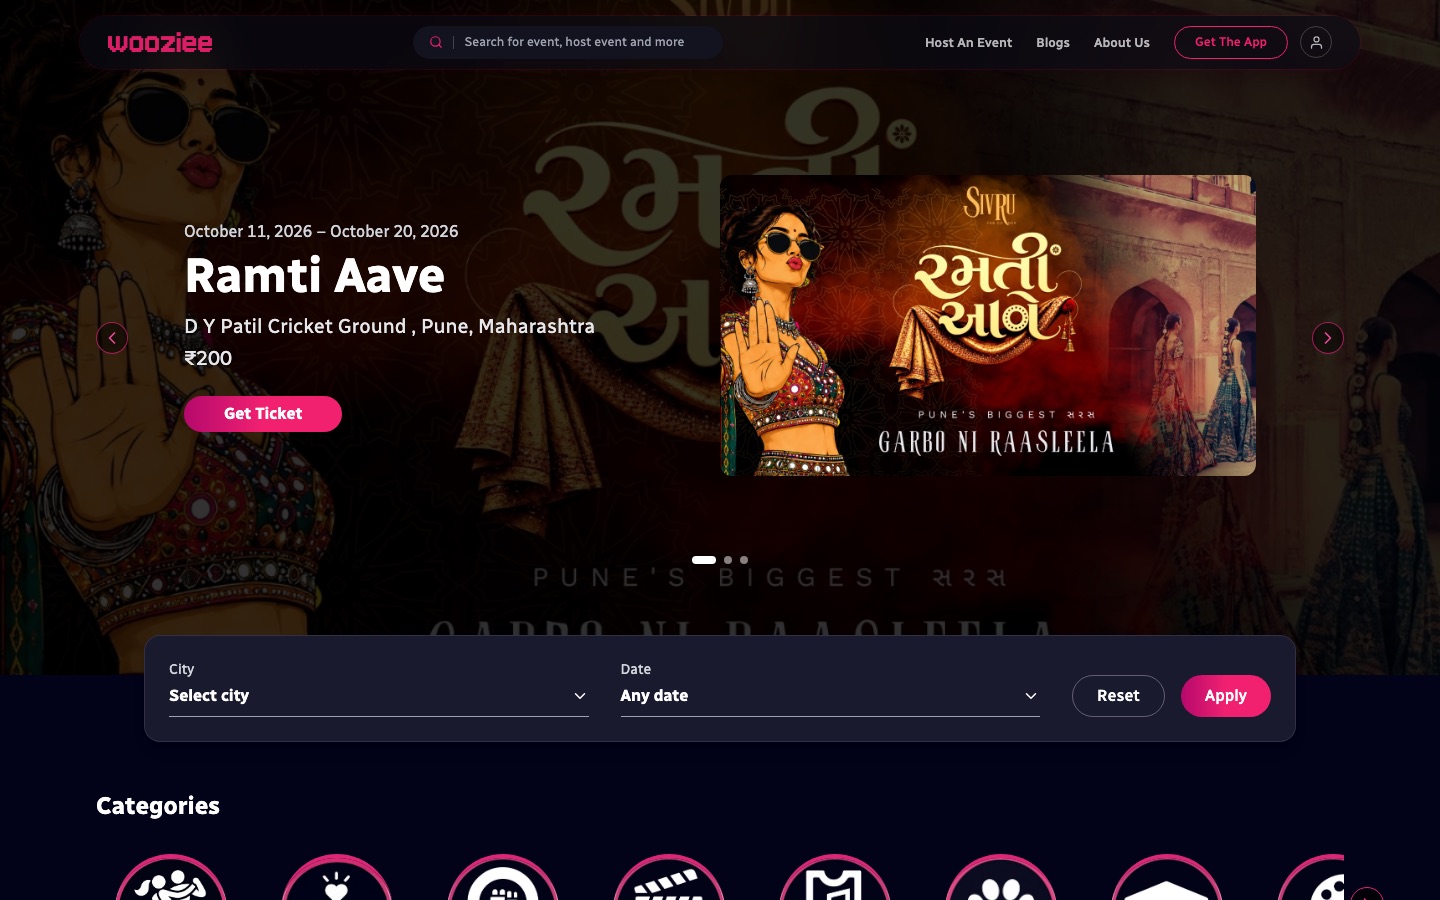
Events & Entertainment
Wooziee
One platform for discovery, checkout, QR entry, organiser analytics and payouts — across web, admin, Android and iOS.
- Web & Mobile
- SaaS & Platforms
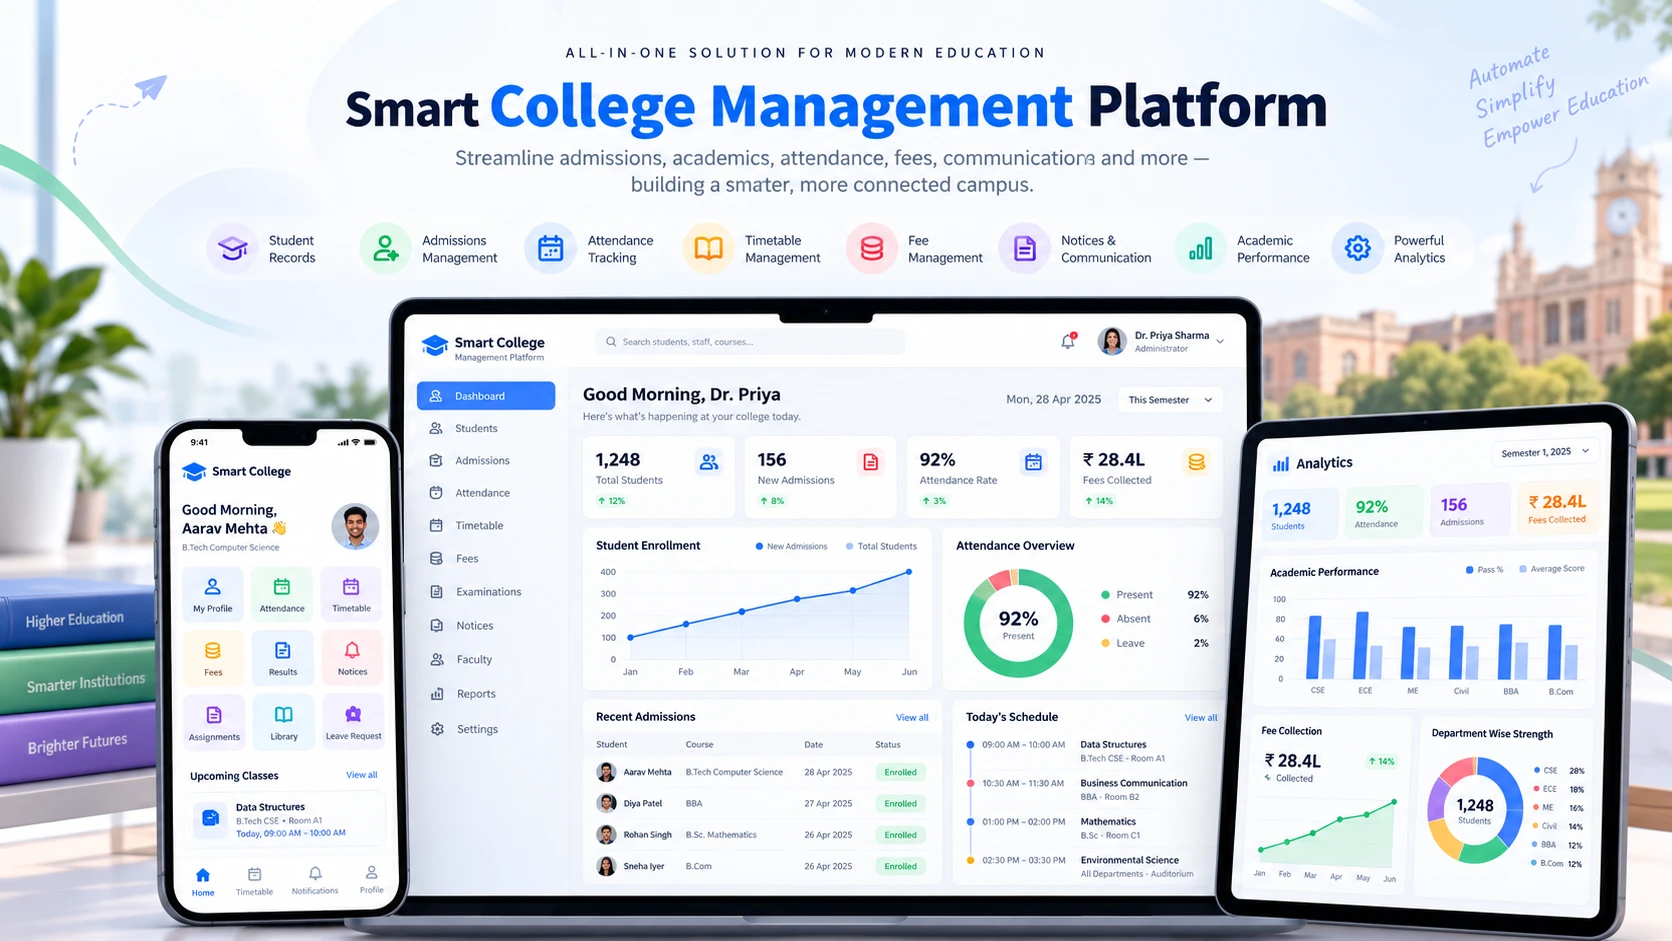
Education
Smart College Platform
Student records, results, notices, messaging and performance prediction for students and administrators.
- Education
- Business Applications
Business benefits
What changes for your organisation.
Hours saved every week
Reports assemble themselves on schedule.
Consistent metrics
Everyone works from the same definitions.
Earlier signals
Trends and exceptions are visible while there's still time to act.
Better conversations
Meetings start from shared facts, not competing spreadsheets.
FAQ
Data Analytics & Business Intelligence: common questions.
Do we need a data warehouse?
Not always. Many organisations start with automated reporting from their operational database or tools. A warehouse becomes worthwhile when you need to combine several sources at scale or keep long histories.
Can you work with Power BI or Looker Studio?
Yes. We can build dashboards in your existing BI tool or embed custom analytics directly into your application.
Can AI write our report summaries?
AI can draft narrative summaries from calculated metrics. We calculate figures deterministically first and use the model only to explain them, which keeps numbers accurate.
How do you ensure the numbers are right?
Metric definitions are documented and agreed, calculations are tested, and outputs are reconciled against source systems during rollout.
Let's talk about data analytics & business intelligence.
Share what's slowing your team down — a manual process, a disconnected system or a product idea. We'll reply with practical next steps, usually within two working days.